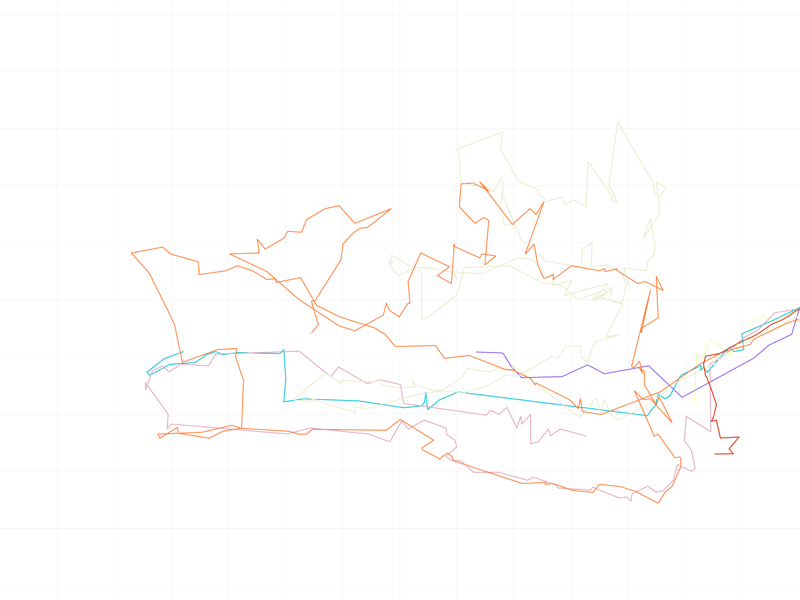
GPS Walks (City of London)
Data animation still
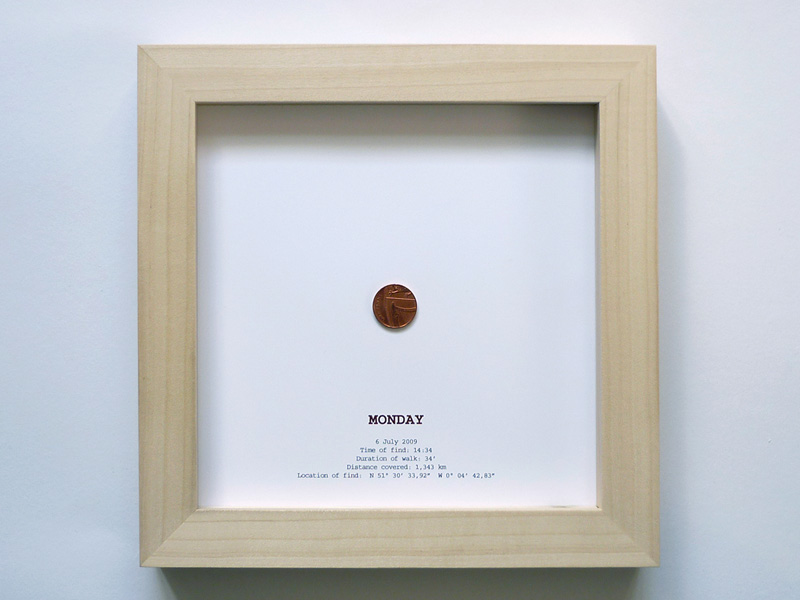
GPS Walks (City of London)
Monday Framed coin, 25 x 25 cm
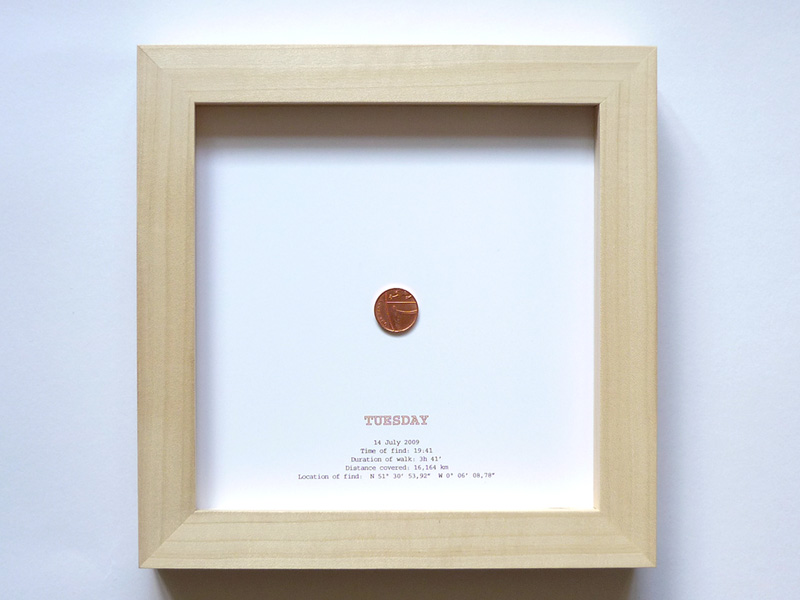
GPS Walks (City of London)
Tuesday Framed coin, 25 x 25 cm
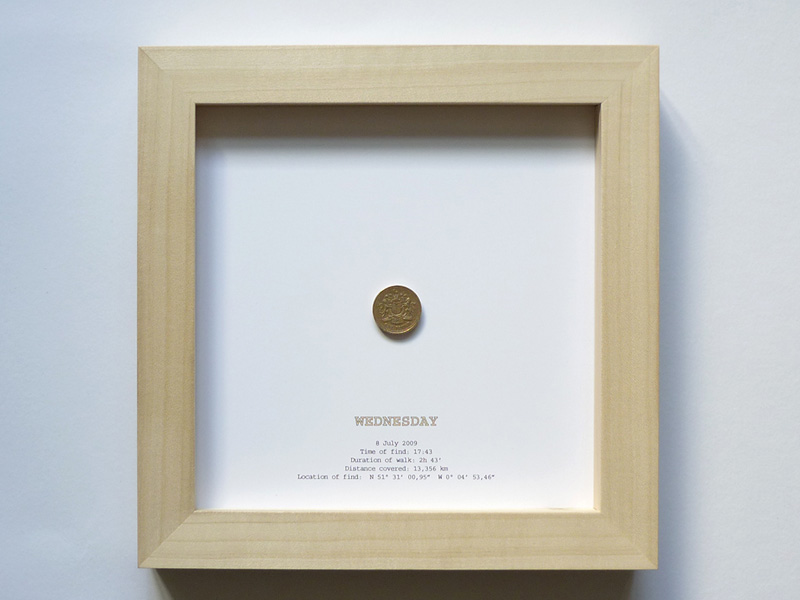
GPS Walks (City of London)
Wednesday Framed coin, 25 x 25 cm
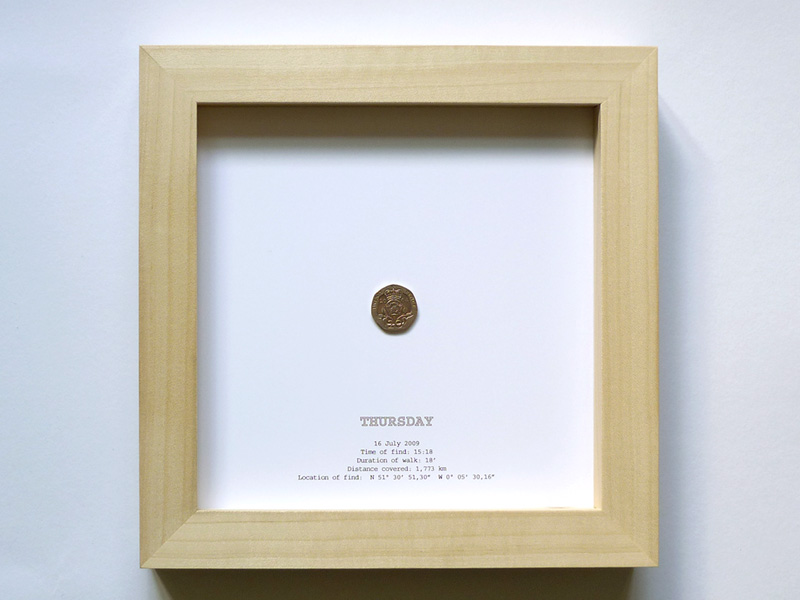
GPS Walks (City of London)
Thursday Framed coin, 25 x 25 cm
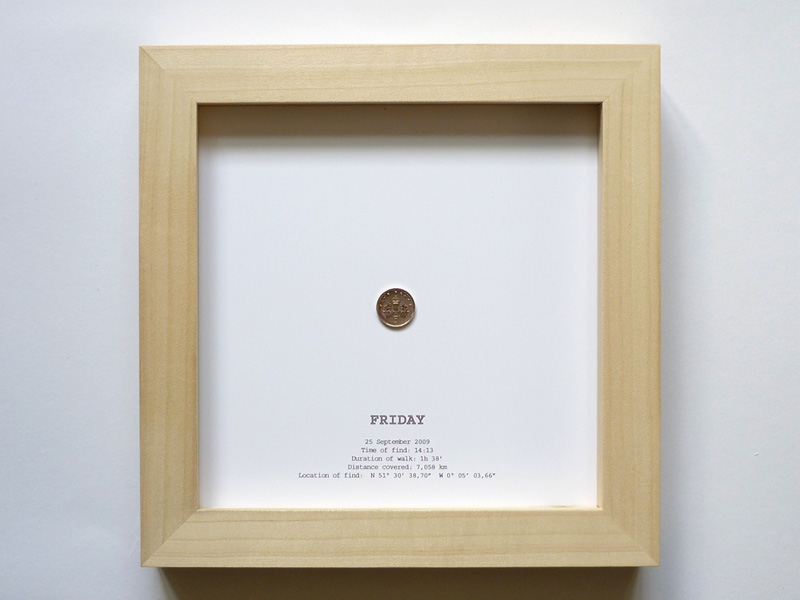
GPS Walks (City of London)
Friday Framed coin, 25 x 25 cm
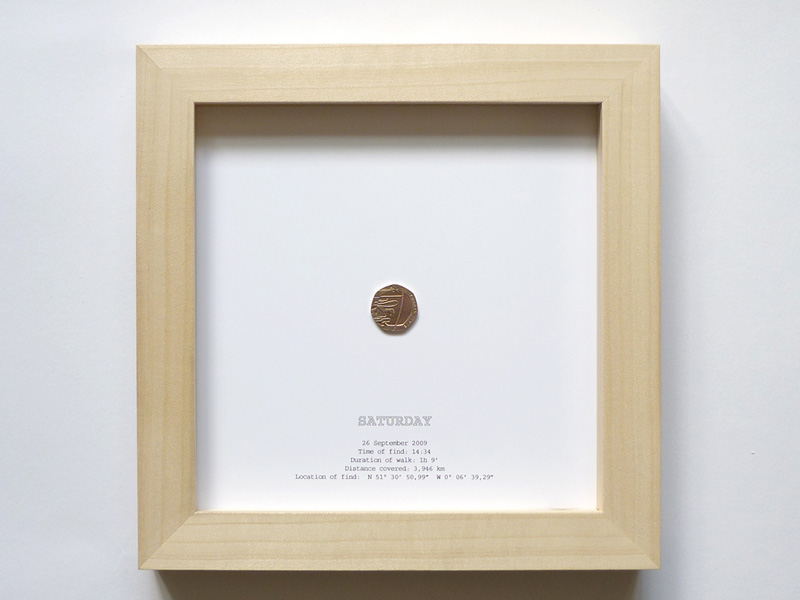
GPS Walks (City of London)
Saturday Framed coin, 25 x 25 cm
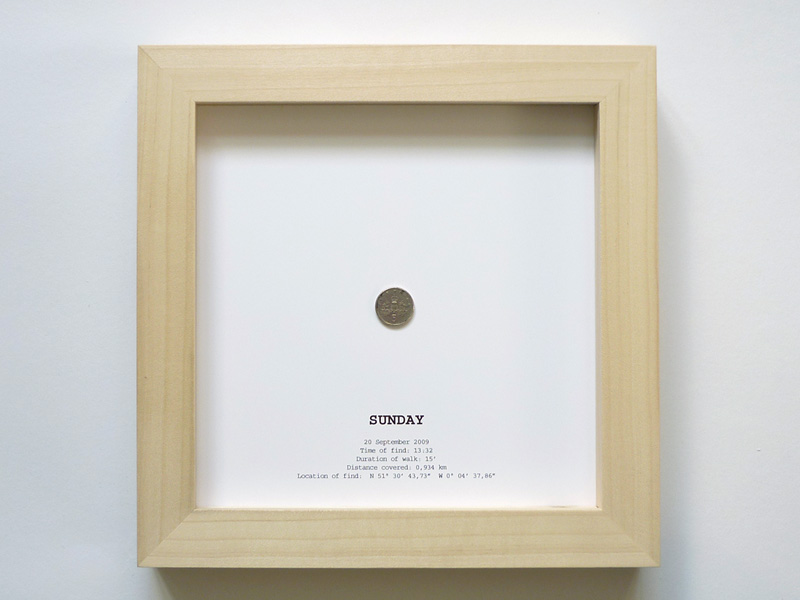
GPS Walks (City of London)
Sunday Framed coin, 25 x 25 cm
GPS Walks (City of London)
Data animation
GPS Walks (City of London)
(2009)
Data animation and 7 framed coins
Frames 25 x 25 cm, computer, 24" screen
Flash file, 3:10 min, loop
Using a portable GPS receiver, Knaub recorded a number of spontaneous walks through the City of London's square mile during the fourth financial quarter in 2009, a time associated with a global financial downturn.
The artists' objective was simple: to walk until he found some money on the street. Each walk, one for each day of the week, is represented in the style of a financial graph, animated by the GPS data generated and ends with the successful find of money.
The work aims to explore the relationship of the individual within the economic context, in particular the connection between time, value and money, as well as commenting on the apparent arbitrary nature of the financial market in general.


